When MICD celebrated its 25th year anniversary in 2011, we thought it would be a good time to reflect on what has been accomplished in the past two-and-a-half decades. What better way to do that than peruse each and every case study project, city, and mayor that has participated in the program? We quickly got to work by coding each case study project and generating these wonderful infographics that reveal fascinating insights about the urban planning and city design trends in America from 1986 to 2011.
GEOGRAPHY
In 25 years of MICD, we have:
Conducted 126 sessions
Discussed 951 case study projects
Engaged 898 mayors in 532 cities
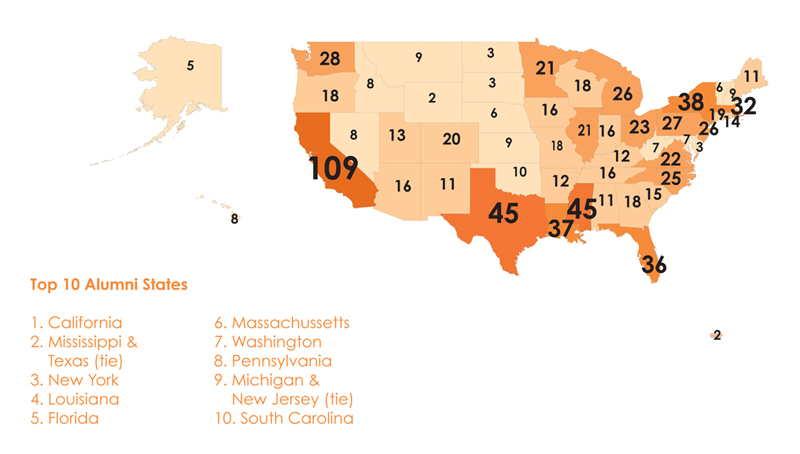
The state-by-state breakdown of alumni mayors shows that California, Mississippi and Texas (tie), New York, Louisiana, and Florida are states with the highest participation rate from 1986 to 2011, followed by Massachusetts, Washington state, Pennsylvania, Michigan and New Jersey (tie), and South Carolina.
REASONS FOR PARTICIPATING
When mayors commit to attending an MICD session, they must select a case study project to present at the Institute. These case studies represent what mayors consider to be their most urgent city design issues. While gathering data on each case study, we also captured the reason for which mayors attended MICD and selected a particular project. In other words, why present one case study project over another? The answer is overwhelming. Mayors generally select MICD case studies based on how much they impact economic development in their cities.

PROJECT SCALE + FOCUS
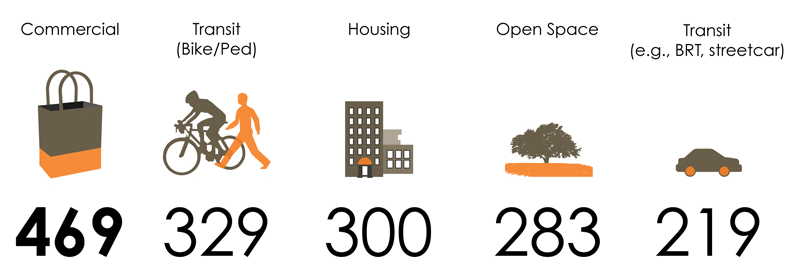
After 25 years of MICD, mayors continue to look for ways to increase their tax base and bring new businesses and people to their cities by creating new development opportunities that focus on a healthier built environment. Given this data, it makes sense that district-scaled projects make up the majority of MICD case studies (40%), followed by corridor-scaled projects as a far second (21%). Projects at a regional scale represents less than 1% of all case studies.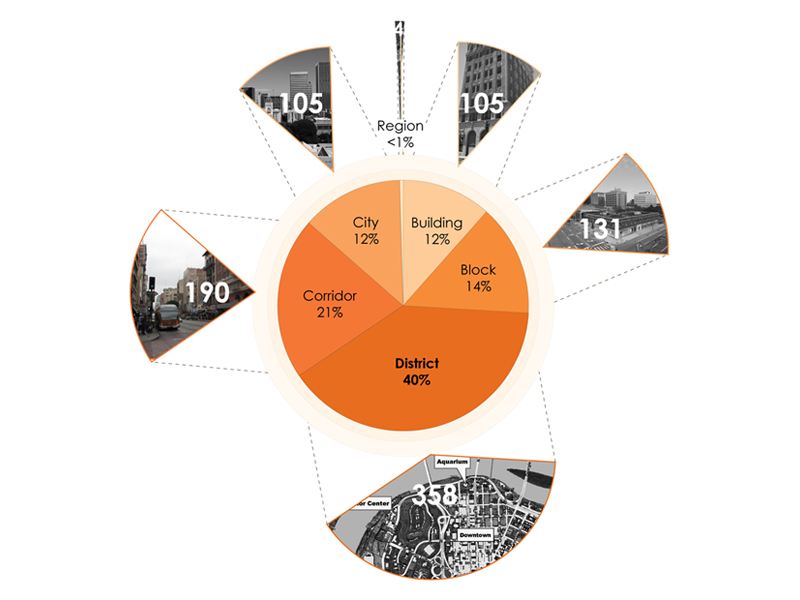 Following the leading trends of economic development and district-scaled projects are case studies that focused on commercial uses. Transit projects that have bike and/or pedestrian components are also popular among mayors in the last 25 years, which is consistent with the trends of corridor-scaled case studies.
What do all these statistics and numbers tell us? In sum, this data gives us a clear snapshot of the issues that mattered most to mayors at MICD over a quarter of a century: district-scaled, commercial/economic development, and transit.